
Construction Progress Monitoring Template: How to Build One
Quick Summary
A construction progress monitoring template is a shared file that records what has been built, what was planned, and what it is costing. It should answer three questions each reporting cycle: are we on schedule, are we on budget, and what is blocking us.
- Track work packages, planned versus actual progress, milestones, budget variance, resources, and issues.
- Set the reporting cadence by how fast the work changes and what external deadlines apply.
- Tie every percent complete to a measurable quantity so the number can be checked.
- Attach dated photos or survey files as evidence for each reported percentage.
- Record a reason note whenever a forecast date changes so the history stays useful.
Table of Contents
- What a Construction Progress Monitoring Template Should Track
- Choosing a Monitoring Frequency and Reporting Cadence
- Building Your Construction Progress Monitoring Template Excel File
- Measuring Progress Objectively and Capturing Site Evidence
- Weekly Construction Progress Report Template Excel Free Download and Daily Report Setup
- Worked Example and Construction Progress Report Examples
- Booking Your First Drone-Based Progress Survey with SkyeTech Aerial
- Frequently Asked Questions
What a Construction Progress Monitoring Template Should Track
Last Updated: November 5, 2026
A construction progress monitoring template is a shared file that records what has been built, what was planned, and what it is costing. A good one answers three questions each reporting cycle: Are we on schedule? Are we on budget? What is blocking us?
A useful template usually tracks these categories:
- Work packages and tasks: Each scope item, its owner, and its current status
- Planned versus actual progress: Percent complete compared against the baseline schedule
- Schedule milestones: Key dates such as foundation pour, dry-in and substantial completion
- Budget and cost variance: Committed, spent and forecast cost by line item
- Labor, equipment and materials: Quantities delivered and installed against plan
- Issues, risks and corrective actions: What went wrong, who owns the fix, and the due date
Keep the list short enough that field staff will fill it in. Every extra column is one more thing that goes stale. Start with the categories a project manager uses in weekly meetings, then add detail only where a decision depends on it.
Watch out: percent complete entered from memory tends to run high. Tie each percentage to a measurable quantity, such as linear feet of footing poured or units installed, so the number can be checked.
Choosing a Monitoring Frequency and Reporting Cadence
The right cadence depends on how fast the project changes, how much money is at risk between reports, and who needs to act on the numbers. Use four inputs to set it deliberately.
1. Rate of change. Ask how much physical work a crew can complete between reports.
2. Cost and schedule exposure. Estimate the value of work performed between reports. If a one-week slip would put a milestone or a payment application at risk, shorten the interval.
3. Contract and stakeholder requirements. Owner reporting requirements, lender draw schedules, and payment application cycles often dictate the minimum frequency.
4. Decision latency. A weekly report that nobody reviews until the monthly meeting is a monthly report with extra steps.
A practical starting point:
| Project Phase | Recommended Update | Who Reviews It |
|---|---|---|
| Site mobilization and earthwork | Weekly | Superintendent and project manager |
| Structure and envelope | Weekly | Project manager and owner’s rep |
| Interior finishes and systems | Biweekly | Project manager |
| Closeout and punch list | Weekly | Full project team |
Daily logs belong on the site, while the template gets a weekly roll-up.
Watch out: if the reporting interval is longer than the time it takes a trade to install a work package, the variance column will show swings that reflect reporting lag rather than real performance.
Building Your Construction Progress Monitoring Template Excel File
An Excel file is the most common starting point because it is cheap, familiar and easy to customize. Use separate tabs so each function has one job.
Use these tabs:
- Setup: Project name, contract value, start and finish dates, and reporting period
- Schedule: Work packages, baseline dates, forecast dates and milestones
- Progress log: One row per work package per reporting period
- Cost: Budget, committed, actual and forecast cost by line
- Issues: Open items with owner, due date and status
- Dashboard: Summary figures that pull from the other tabs
Lock formula cells so that a field user cannot overwrite a total by accident. Use data validation drop-downs for status values such as “Not started,” “In progress,” “Complete” and “On hold.” Consistent status words make filtering and reporting reliable.
Setting Up Planned Versus Actual Progress Columns
Planned versus actual is the core of progress monitoring. For each work package, record the planned percent complete for the period and the actual percent complete measured on site. The gap is the variance.
Set up these columns in the progress log:
- Work package ID
- Baseline start and finish
- Planned percent complete (from the baseline)
- Actual percent complete (from site measurement)
- Variance (actual minus planned)
- Evidence reference (photo or survey file name)
Calculate variance with a formula rather than typing it. A negative variance flags a package that is behind. Conditional formatting that turns those cells red makes the problem visible at a glance.
Adding Budget, Schedule Variance, and Milestone Tracking
Budget and schedule should share the same work package IDs so a delayed task can be linked to its cost impact. Add a schedule variance column that counts days late against the baseline finish, and a cost variance column that compares forecast cost to budget.
Track milestones on the Schedule tab with a status flag. A milestone is “at risk” when its forecast date moves past its baseline date, even if the work is still in progress. Flagging risk early gives you time to act.
Watch out: if you update forecast dates without recording why they moved, the history becomes useless. Add a short reason note to every forecast change.
Measuring Progress Objectively and Capturing Site Evidence
Percent complete is only as good as the method behind it. Subjective estimates produce disputes; objective measures hold up when a subcontractor disagrees. Standardized metrics provide the necessary foundation to verify contractor workmanship, ensuring that physical progress aligns with the reported completion data.
Choose a measurement method per work package. Not every scope can be measured the same way. Pick one method and write it into the template next to the work package ID:
- Units completed: linear feet of pipe installed, square feet of drywall hung, cubic yards of concrete placed, units of equipment set. Use when the work is countable and uniform.
- Milestone or stage gates: foundation complete, dry-in achieved, rough-in inspected. Use when the work is binary and inspection-driven.
- Weighted steps: assign percentages to defined sub-steps, such as 40% for framing, 40% for rough-in, and 20% for inspection. Use when a package has distinct phases that cannot be counted in units.
- Earned value: multiply percent complete by the budgeted cost of the work package to get earned value, then compare to actual cost. Use when cost and schedule need to be judged together.
Set rules for partial completion. Most disputes come from partial credit. Define in advance what counts as complete for each step.
Require evidence for every reported percentage. A number without evidence is an opinion. Pair each measurement with a dated photo, a location tag, and a short caption. Drone imagery can add a consistent, repeatable view of the whole site, making period-to-period comparison easier.
Run a field-to-office workflow. The measurement is only useful if it reaches the template intact. A repeatable sequence:
- The field lead records quantities and photos on a mobile device during the site walk, using the same work package IDs as the template.
- The field lead syncs or uploads the records to the shared folder before leaving the site.
- The project engineer reviews each entry against the evidence and flags missing or conflicting data.
- The project manager approves the progress log for the reporting period.
- The approved log feeds the dashboard and the client report.
Spreadsheet-based workflows have limits: version conflicts, overwritten formulas, and files that live on one person’s laptop.
Assign ownership and handle bad data. The field lead owns quantities and photos, the project engineer owns evidence review, and the project manager owns approval.
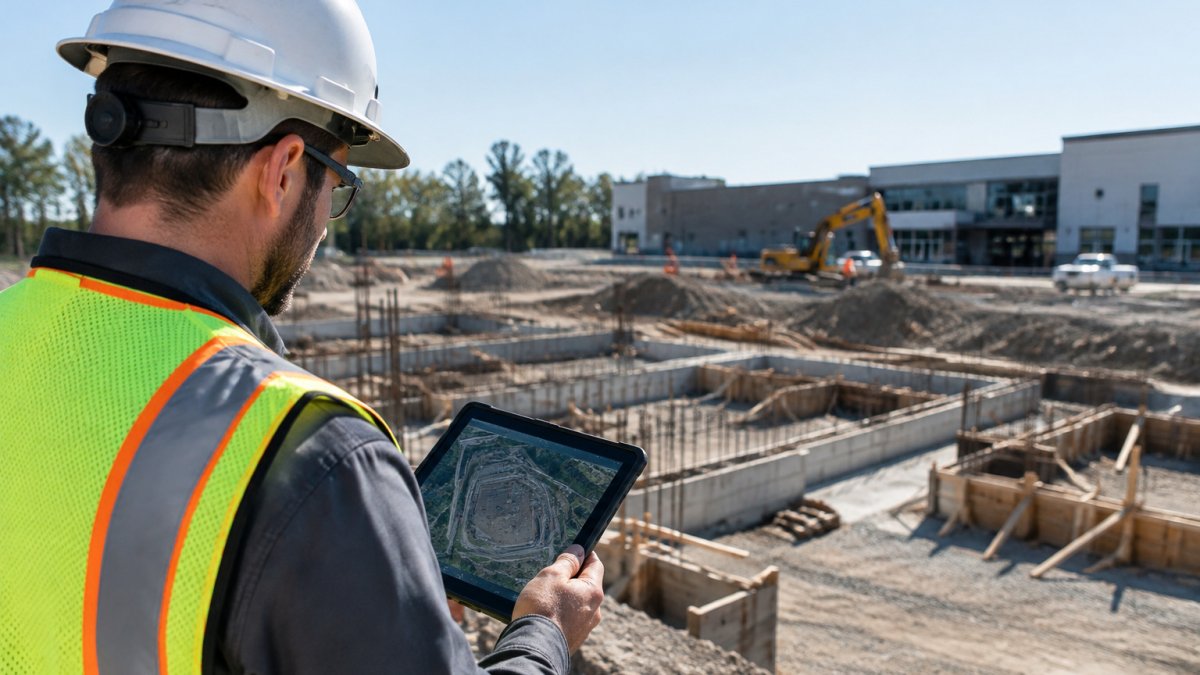
Here, a construction superintendent reviews site progress against the plan:
Watch out: if the measurement rule changes mid-project, prior percentages are no longer comparable. Record the rule version in the template and note any change with the date it took effect.
Weekly Construction Progress Report Template Excel Free Download and Daily Report Setup
Many teams search for a weekly construction progress report template Excel free download as a starting point. A free template can work, but check that it includes planned versus actual columns, variance formulas and an issues log. Templates that only list tasks with a “done” checkbox will not show schedule risk.
For daily reports, keep the form short. Record weather, crew counts by trade, equipment on site, work completed, delays with cause, and visitors or inspections. Daily entries feed the weekly roll-up, so consistent wording matters.
A simple weekly report structure:
- Executive summary (three to five sentences on overall status)
- Schedule status with milestone table
- Cost status with variance commentary
- Progress by work package
- Open issues and corrective actions
- Look-ahead for the next two weeks
Customize the template for your contract. A public infrastructure job may need different reporting fields than a private commercial build.
Worked Example and Construction Progress Report Examples
Consider a three-story office building with a 14-week structural phase. In week 6, the progress log shows the level-two deck at 45% planned and 38% actual, a variance of minus 7%. The evidence column links to a drone survey taken that morning. The issues tab shows a rebar delivery delay as the cause, with the owner set to the procurement lead and a due date of the following Tuesday.
The weekly report states the variance in plain terms, names the cause, and shows the recovery plan. Management sees one milestone at risk, with the reason and owner listed in the same place.
Construction daily report template examples follow the same logic. A useful daily report answers what happened, what it cost, and what is blocked, in fewer than ten lines per trade.
Here is an example of how orthomosaic mapping supports the same review:
Booking Your First Drone-Based Progress Survey with SkyeTech Aerial
If your team relies on manual site visits and field estimates, adding drone-based survey data can make progress percentages easier to defend. SkyeTech Aerial flies missions under FAA Part 107 standards, uses FAA-certified pilots, and carries full insurance. Our team processes imagery with platforms such as DroneDeploy, Pix4D and DJI Terra, so the output can feed directly into your progress log.
Pricing depends on site size, flight frequency, and deliverables, so we quote each project individually. Request a free quote from SkyeTech Aerial to discuss your site, your reporting cadence, and the evidence you need for your next progress review.
Frequently Asked Questions
What should a construction progress monitoring template include?
A useful template tracks work packages, planned versus actual completion percentages, schedule milestones, labor and equipment hours, budget spent against budget planned, issues and risks, and dated site photos or drone captures as evidence. Keep each row tied to a specific task so anyone reading the file can see what was done, when, and by whom. Start with a small set of fields and add more only when a stakeholder asks for them.
How often should construction progress be reported?
Most project teams update progress tracking weekly and send a formal weekly construction progress report to owners and stakeholders. Daily reports capture field activity and issues, while monthly reports suit owners who need a summary of cost and schedule performance. The right cadence depends on project size, schedule risk, and contract requirements, so confirm reporting obligations in your contract before you set the rhythm.
What is the difference between a construction progress report and a daily report?
A daily report records what happened on site that day, including crew counts, equipment used, weather, deliveries, and delays. A construction progress report summarizes overall advancement over a period, comparing planned progress with actual progress and explaining schedule variance. The daily report feeds the progress report, so keeping daily entries consistent makes weekly reporting much faster.
How do you compare planned progress with actual progress?
Divide each work package into measurable units, assign a planned completion percentage for each reporting period, then enter the actual completion percentage from field verification. Subtract actual from planned to find the variance for each task, and flag anything behind schedule for corrective action. Verifying actual percentages with dated photos or drone survey data reduces disputes about how much work is complete.